
2,316 visits to this page
We see what visitors do.We fix what gets in the way.You get more enquiries.
Analytics shows how people use your website, and it comes with every Coullweb website. We spot where visitors get stuck and suggest a change. Say yes, and we make it and show you the result. No tools to learn. Nothing extra to pay.
- WatchSee where visitors get stuck
- ImproveMake one change at a time
- ReportShow you what changed
An example garden-room website with an enquiry form. Moving lines show how visitors use the page, and many stop at the Budget question. All the data is made up.
38% of people who reach ‘Budget’ leave the form there
Ask fewer questions: 9 → 4
IncludedEasy to undo
The problem
The data is there. Nobody is using it.
Most websites already collect plenty of numbers. The trouble is what happens next. Do any of these sound like you?
Something drops. Nobody notices.
Google sends fewer visitors, or a key page slips. It sits in a report no one opens, and you find out months later.
Your form breaks. Enquiries stop.
An update breaks the enquiry form. Visitors keep coming, but nothing gets through. Nobody is checking, so it stays broken for weeks.
The report arrives. Nothing changes.
Every month, pages of charts. Sessions up, bounce rate down. Nobody can say what to do next, so nobody does anything.
Example sitesThese businesses are made up. The screens show the kind of thing we find on real websites.
Sound familiar? We watch your site every week, fix what gets in the way, and tell you what changed.
The fix, proven
We’ve fixed this before. Here’s one we made earlier.
P3MO makes software that helps organisations deliver big programmes of change. Their website has one job: get the right people to book a demo. Today every route leads to one clear “Book A Demo” button and one short form. So every request can be counted.
B2B softwareDemo requestsWebsite and analytics
- 01Watch. Find every way a buyer can ask for a demo, and check each one is counted.
- 02Improve. Give them one clear route: one “Book A Demo” button and one short form.
- 03Report. Count each request as an enquiry, so the report shows what brings in demos, not just visits.
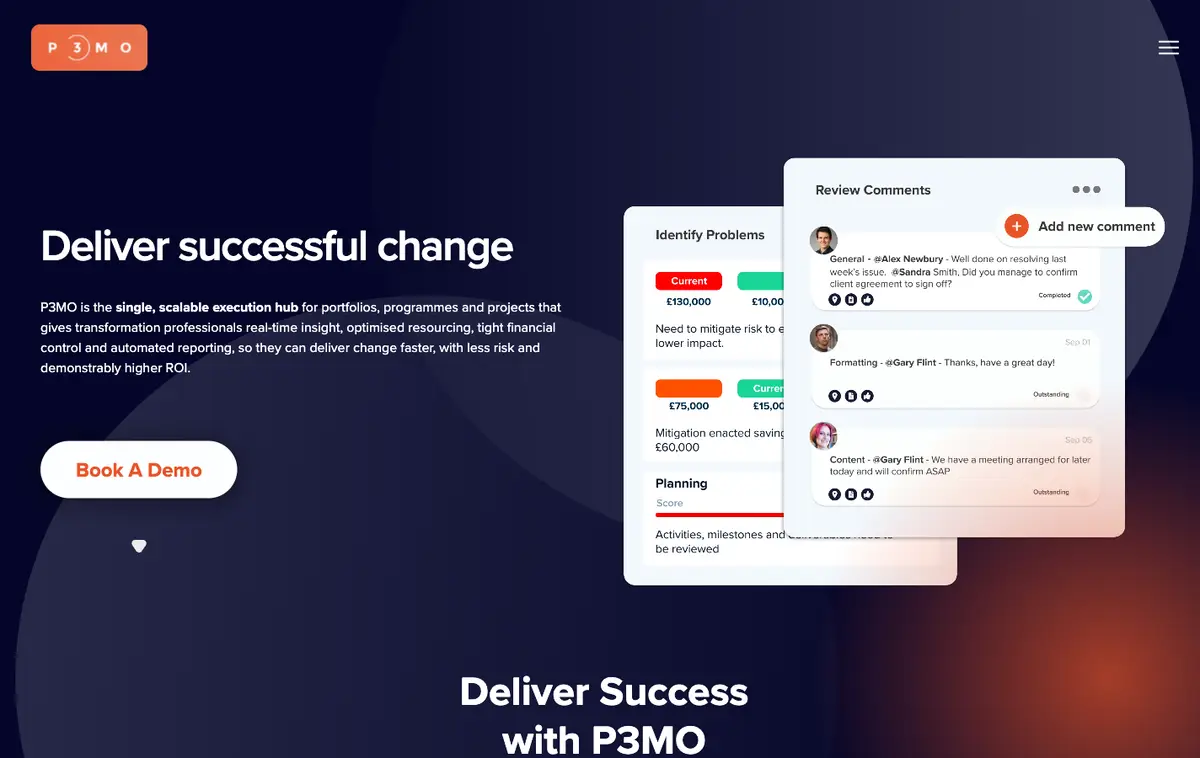
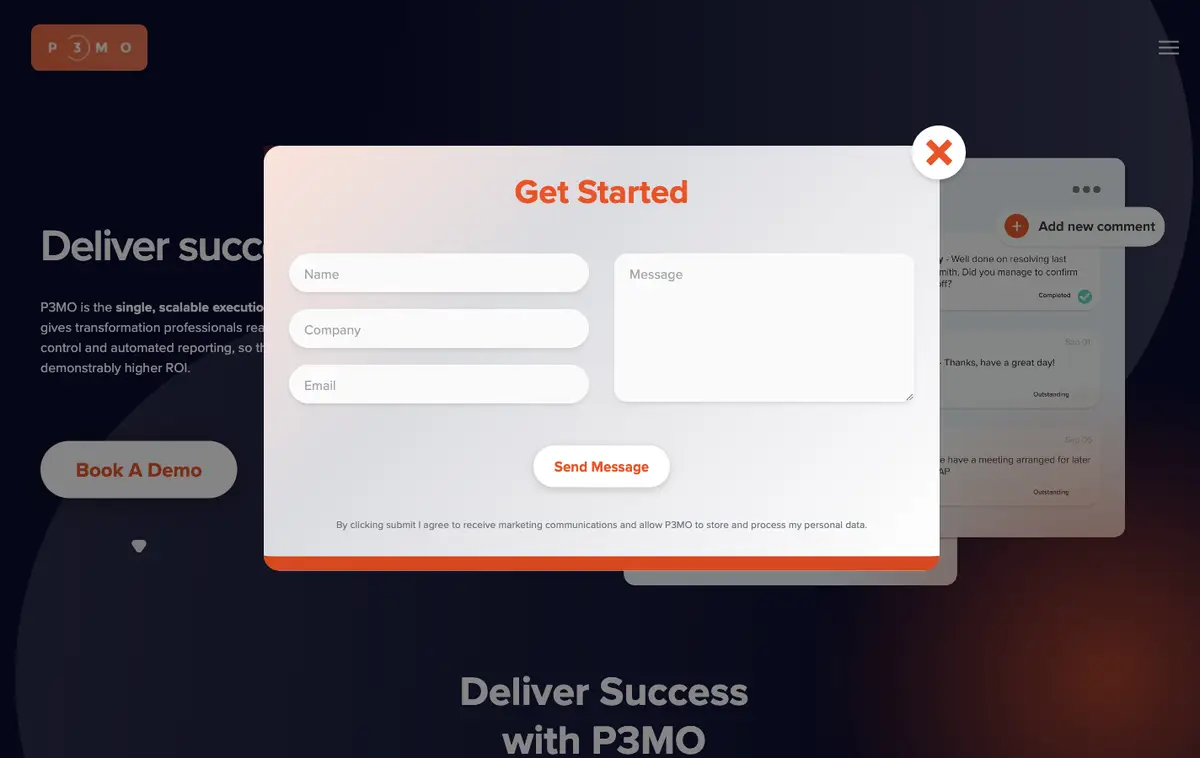
Before. Demo requests land in an inbox as identical emails.
It’s great being able to send over a few changes and know they’ll be taken care of. Keeping the website up to date has become much easier for us.
Want the same for your site? We’ll show you which enquiries you’re counting, and which you’re missing.
The plan
Three steps. Every month.
Tracking is set up in your first week. After that, it runs every month as part of your plan. You just say yes or no to each change.
Step 01Week 1, then weekly
Watch
We set up tracking for every way people get in touch: forms, calls, emails and bookings. Then we check how visitors use your site every week.
You get- Tracking on every route to an enquiry
- Google Analytics and Search Console set up and linked
- A weekly check for drops, errors and broken forms
With Intelligent AnalyticsIt shows each visit and the enquiry it became. No charts to puzzle over.Step 02Every month
Improve
We pick one change that real visits say will help, and explain why. Say yes, and our UK team makes it. Your monthly plan covers it.
You get- One clear suggestion, with the reason behind it
- The change made and checked on phone and desktop
- The old version kept, so it’s easy to undo
Your callNothing changes until you say yes. Say no, and we suggest the next idea.Step 03Every month
Report
We count enquiries, not clicks. You get a short, plain-English summary: what happened, what we changed and what’s next.
You get- Enquiries, and where they came from
- Each change measured against the original
- What we’ll try next, and why
With Intelligent AnalyticsYour summary lands in your inbox. Open the dashboard any time for the detail.
No tools to learn. A few minutes a month from you. We do the watching and the work.
Inside one month
One change, start to finish.
Here’s a month on an example garden-room website. Scroll to follow one change from the first visit to the result.
We watch how visitors use your site.
We see where people move, pause, scroll and leave. Real visits, not guesswork, show us where the friction is.
We find where visitors get stuck.
Here, 38% of people who reach the budget question give up, even though it’s optional. On phones, it’s worse.
We suggest a change and explain why.
You get one clear suggestion, the reason for it and what we expect to happen. Nothing changes until you say yes.
We make the change for you.
Our UK team makes the change, and your monthly plan covers it. We keep both versions and show each to some visitors. Here, the form goes from 9 questions to 4.
You see the result.
We count enquiries, not clicks. Once the new version clearly wins, everyone sees it. Here, 4.2% of visitors sending the form became 6.9%.
Step 1 of 5Moving lines show visits to the example page
More changes we often make
Pick a change. Drag to compare.
Small, careful changes add up. Here are four we often make, shown on an example garden-room website, with the sort of result we look for.
Drag the handle, or focus it and use the arrow keys.
Ask fewer questions at the start.
What we noticed
38% of people who reach ‘Budget’ leave the form there, even though they can skip it. People using phones are 2.3× more likely to leave before finishing.
What we changed
Cut the form from 9 questions to 4. Ask about budget during the meeting. Make the button say what happens next.
What we measured · visitors who send the form
+2.7 pts
The rate rises from 4.2% to 6.9%. That means about 64% more enquiries from the same number of visits.
Example data. Whiskers show the likely range of the true figure.
Price
Included. Nothing extra to pay.
Analytics comes with every Coullweb pay monthly website. Pick the growth plan that fits. We watch, improve and report on all of them.
Website analytics
Included in every growth plan
One monthly fee. Rolling 30 days. Cancel any time.
Book a callWhat’s included
- Tracking set up for every way people get in touch
- We check how people use your site every week
- Suggested changes, with the reason for each
- Changes made by our UK team, and easy to undo
- Intelligent Analytics, so you can see what’s working
- CareIntelligent Analytics summary in your inbox
- GrowA plain-English report every month
- ScaleA new test every month
Pairs well with
Now you can see it. Make more of it.
Analytics tells us what to fix. These services are how the bigger fixes get done.
Intelligent Analytics
The dashboard behind your reports.
See which pages and channels bring real enquiries, in plain words. Open it whenever you like.
Explore Intelligent Analytics
Conversion rate optimisation
A bigger push on your enquiries.
A focused six-week project when one change a month isn’t enough.
Explore CRO
SEO
More of the right people finding you.
When Search Console shows a drop, this is how we win the traffic back.
Explore SEO
Not sure what you need? Tell us your goals. We’ll suggest the one thing worth doing first.
FAQ
Not sure yet? Fair enough.
These are the doubts we hear most, with straight answers. Can’t see yours? Ask us on a call.
No catch. Analytics comes with every growth plan, as part of one monthly fee. There’s nothing extra to pay for the watching, the suggestions or the changes we make as part of your plan.
Having it isn’t the hard part. Using it is. Many accounts don’t count enquiries at all, and nobody looks at them each week. We set it up to count what matters, check it weekly and act on what we find.
Intelligent Analytics is the dashboard. This is the service: our team uses it alongside Google Analytics and Search Console to watch your site, suggest changes and make them. The dashboard comes with it. See Intelligent Analytics.
That’s why ours is short. What happened, what we changed and what’s next, in plain English. And you don’t have to act on it. We do.
No. We do the checking. You get a short summary and, now and then, a suggested change to say yes or no to. You can open Intelligent Analytics whenever you’re curious.
Never. Nothing goes live until you say yes, and every change is easy to undo.
We measure it against the original. If it doesn’t help, we put the old version back and try the next idea. You still learn something either way.
No. Growth plans run on a rolling 30 days. You can cancel any time.
Intelligent Analytics doesn’t need a cookie banner. Where we use Google Analytics as well, it only runs with your visitors’ consent. We never record what people type into forms.
Tracking is in place in your first week, so you’ll see where enquiries come from straight away. Each change then needs a few weeks of visits to measure. Quieter sites take a little longer.
Start here
A website thatkeeps getting better.
Book a call
Analytics comes with your monthly plan. No contract and no extra cost. Or email hello@coullweb.com
Tell us about your site
A short form. It takes about two minutes.
We book a 20-minute call
We show you what analytics would look like on a website like yours.
You get a plan and a price
A short written plan. No pressure to go ahead.