
Heatmaps
WhereYour top product, basket and checkout pages, on phone and desktop.
62% of clicks near the top land on a product photo that doesn’t open.
Ecommerce conversion rate optimisation for Shopify and Magento shops. We find where shoppers give up, at the product page, basket or checkout, fix it ourselves and show you what changed.
The problem
Most online shops lose sales in the same three places. Do any of these sound like you?
They get as far as the basket, then go. You never find out what stopped them.
A forced account, a surprise delivery cost and too many boxes. Shoppers give up at the last step.
Everyone has a guess. No one has proof. So changes get made at random, and nothing really moves.
Sound familiar? We’ll show you where your site loses buyers, and what to fix first.
Where shops lose orders
Most online shops lose sales in the same four places. We watch how real shoppers move through each one, fix what gets in the way and measure the result.
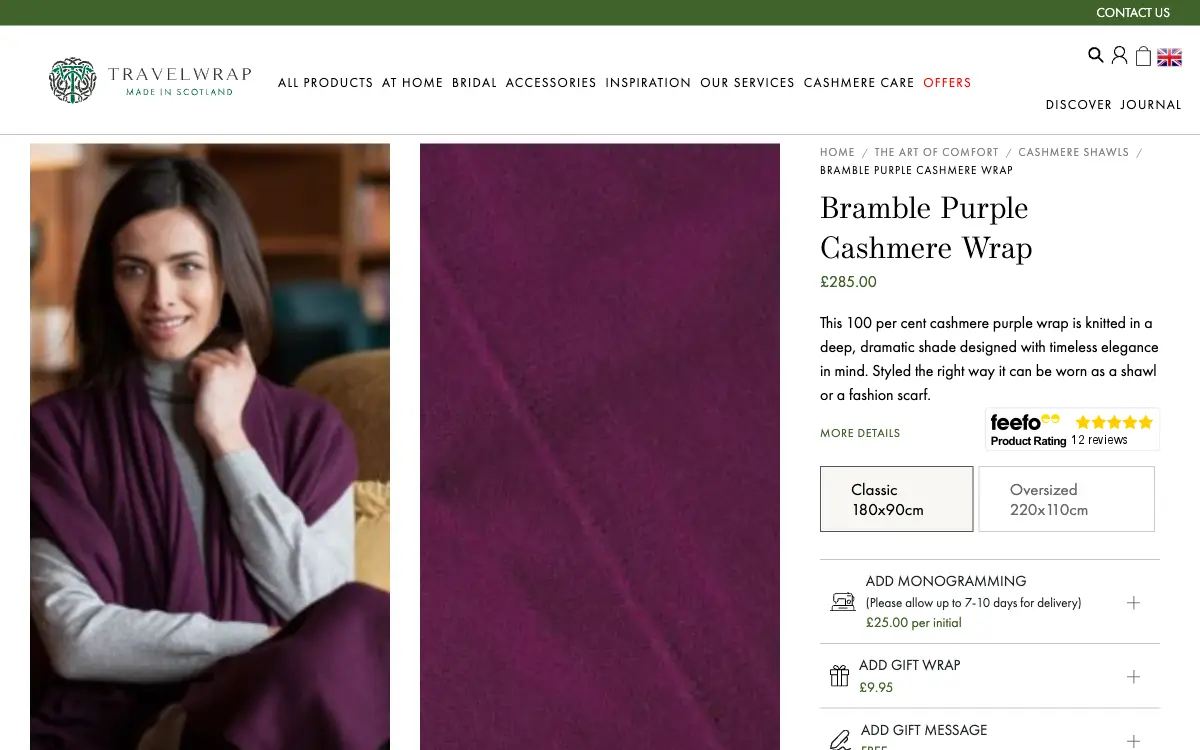
We built The Travelwrap Company’s Magento 2 shop and now watch how shoppers use it every month. Results from the latest round of changes are due in mid-November 2026. Read the case study. We also built and look after the Mayfair Gallery shop.
Want to know where your shop loses orders? Show us your busiest product page and we’ll tell you what we’d change first.
The plan
It takes about six weeks. You give us around an hour a week. We do the heavy lifting.
We study how shoppers move through your shop. We look at your data, watch anonymous visits and read what customers ask your team.
We fix the biggest problems first. Clearer product pages, a simpler basket and a shorter checkout. You approve every change before it goes live.
We compare before and after. You get a short, plain-English report on what got better and what to try next.
Six weeks. About an hour a week from you. Pick a start date that suits your team.
Inside step 01 · Understand
No single tool tells the whole story. Heatmaps show where people click. Recordings show how they move. Surveys show why. Analytics show how many. User tests show how it feels. We only act where they agree.
All visits are anonymous. We never record what people type into forms.
Example figures, to show what each method finds.
Keep scrolling — the strip moves sidewaysYour top product, basket and checkout pages, on phone and desktop.
62% of clicks near the top land on a product photo that doesn’t open.
A few hundred visits, focused on people who left.
1 in 6 phone shoppers tap “Size” again and again. Most of them leave.
One question, shown as people are about to leave.
“What nearly stopped you ordering today?” · 412 answers.
Twelve months of data, split by device and source.
People on phones finish checkout 19 points less often. They’re 58% of visits.
Eight people who match your real customers.
“Why do I have to make an account to buy one scarf?” — P3
Task: buy a gift and say when it will arrive. 3 of 8 managed it.
One team
Many CRO reports end with a to-do list for your developer. We build and run Shopify and Magento shops, so on the shops we run, we make the fix ourselves and measure it.
Price
You know the cost before we start. If your site needs more, we tell you first and you decide. Prefer to go month by month? Insights is £500 a month, or £895 with Improvements.
Pairs well with
More orders go further when the rest of your shop pulls its weight too.
Shopify development
Themes, apps and a checkout people finish.
Magento 2 development
Builds, upgrades and support for larger shops.
Speed optimisation
Faster product and checkout pages on phones.
Not sure what you need? Tell us your goals. We’ll suggest the one thing worth doing first.
It’s great being able to send over a few changes and know they’ll be taken care of. Keeping the website up to date has become much easier for us.
FAQ
These are the doubts we hear most, with straight answers. Can’t see yours? Ask us on a call.
Usually a surprise: a delivery cost or date they didn’t expect, a forced account, or a way to pay they don’t use. Some are just comparing. We watch where it happens on your shop and fix the causes we can see, starting with the biggest.
It depends on what you sell, how much it costs and where your visitors come from, so comparing with averages can mislead. What matters is whether your own rate, and your basket value, go up after each change. That’s what we measure.
Yes. Insights works on any shop, whoever built it. We make the changes ourselves on Shopify and Magento shops we build and run. If someone else runs yours, your developer can work from our report.
The free Friction Audit is for shops with 4,000 or more visitors a month, so there’s enough real behaviour to learn from. Below that, side-by-side tests take too long, but many fixes are still clear from recordings and surveys.
No. We keep your brand and look. We only change what gets in the way, like product page layout, basket, delivery information and checkout steps.
The Friction Audit is free for shops with 4,000+ visitors a month. Insights is £500 a month, Improvements is £500 a month, or £895 for both, on a rolling 30 days. A six-week sprint has a fixed quote. See how that compares with other UK CRO prices.
Each change needs a few weeks of orders to measure fairly. Busier shops see results sooner. We report what changed every month, including the changes that didn’t help.
They can. We’ll give them clear briefs and check the work before it goes live. Or, if you move to a shop we build and run, we make the changes ourselves.
Start here
A short form. It takes about two minutes.
We listen, look at your site together and answer your questions.
A ranked list of what to fix first, and a call to walk you through it. No pressure to go ahead.